
We all know that in general Excel application is for calculations and PowerPoint is for visual presentation. So all the data is prepared in worksheet, based on which all the charts in PowerPoint are created. In this article I will show You how to update PowerPoint chart data from Excel using VBA.

This knowledge, how to update PowerPoint chart data automatically, is really useful for weekly, monthly or any other periodic reports, which uses same PowerPoint template. So let’s go straight to that and start with the example pie chart.

To edit the pie chart data just right click on chart area and select Edit Data in Excel.

After clicking it pops up the Excel workbook with “Chart” in the title bar.

So this is the way to change chart data manually. But if there is the way to change it like that, there is also the way to change it automatically!
But before we go to the VBA world You need the name of the chart, and for sure it is not “pie chart”.
Select the chart and go to Chart Tools. There choose Format tab and select Selection Pane.

And then appears the panel on the right side of the screen. In our case we can see only 1 shape name in the list.

If You want to change default name of the object just double click on it and type yours. For this article I will stay with this default one.
OK, got everything we need.
Time to automate the data update
First of all we need to open the template. To open choosen PowerPoint presentation and set its first slide to object variable use this.
pp_path = "...\Presentation1.pptx" 'your PowerPoint path


Set PowerPointApp = CreateObject("PowerPoint.Application")
Set draft = PowerPointApp.Presentations.Open(pp_path)
Set slide = draft.Slides(1)
If You Add Watch on slide variable You can find in its Shapes the graph shown below.
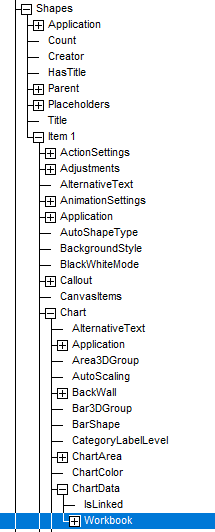
Now, knowing the path to the PowerPoint chart workbook, You can easily update the data, just like in case of chart data in Excel application. Use copy paste method, array method or simply type specified numbers in code to change the values on chart.
With slide.Shapes("Chart 5").Chart.ChartData.Workbook
    With .Sheets(1)
        .Cells(2, 2).Value = 7.9
        .Cells(3, 2).Value = 4.1
        .Cells(4, 2).Value = 1.5
        .Cells(5, 2).Value = 0.8
    End With
End With
Full code
Gathering the code lines together and adding some other like declarations, saving and closing PowerPoint presentation, it results in this.
Option Explicit

Sub update_pie_chart_data()

Dim PowerPointApp As Object, draft As Object, slide As Object
Dim pp_path As String

pp_path = "...\Presentation1.pptx" 'your PowerPoint path


Set PowerPointApp = CreateObject("PowerPoint.Application")
Set draft = PowerPointApp.Presentations.Open(pp_path)
Set slide = draft.Slides(1)

With slide.Shapes("Chart 5").Chart.ChartData.Workbook
    With .Sheets(1)
        .Cells(2, 2).Value = 7.9
        .Cells(3, 2).Value = 4.1
        .Cells(4, 2).Value = 1.5
        .Cells(5, 2).Value = 0.8
    End With
End With


draft.SaveAs ThisWorkbook.Path & "\Presentation " & VBA.Format(Now, "dd.mm.yyyy") & ".pptx"

draft.Close
Set draft = Nothing

PowerPointApp.Quit
Set PowerPointApp = Nothing

End Sub
And the pie chart after the coding part.

Few end words
Now You should know how to update chart data in your periodic PowerPoint reports. Expanding this example code can make your weekly tasks take only a moment.
The choice is yours.
Hello,
Your example works great however when I try to use it for radar chart or a map chart, I cannot use the code to edit the data. I receive the error “This member can only be accessed for a chart object”.
How can I make it work for those charts as well. They both have a worksheets with source data when I right click on the charts and go to “edit data”.
Thank you very much in advance for your time and help.
Kind regards,
Ron
Hello Ron,
Have You tried instead of .Chart.ChartData to use .Chart.SetSourceData ? 🙂
Hello, I am new to VBA world and trying to populate the backend data using a name range. Can you share the skeleton of the code for this?
Hello
The code is in the article, what do You mean?
In the above code, we have the values hard coded for a simple chart with with 4 vlaues. But Iam trying to populate a bar graph with recent 52 weeks data and have multiple slides with many such charts. I am trying to automate this by giving name ranges to each table in excel and trying to pull data into the slides using those name ranges
Ok, and what have You achieved so far? 🙂
Hello, Tomash!
vvhat I need to do if I have 5 values for next version of this diagramm?
Have You tried to add those values? 🙂