
In the doughnut type charts Excel gives You no option to change the position of data label. The only setting is to have them inside the chart. But is this making You not able to make doughnut chart with outside end labels?

Let’s start with the pie
Pie charts are round, tasty, nice looking charts. They are used to make your presentation more interesting. Everyone is tired with that tables and column charts type. They are too common. Too boring.
That’s why we are using them. But enough with that. You are not here to learn or read my side about why or how to use it in your PowerPoint presentation. You are here, because You want to know how to create it automatically, using VBA.
But not really pie chart type. You are here, because of that more tasty doughnut type. But…
First things first

What pie charts have what doughnuts not?
Data labels positioning.
Take a look at this pie chart properties on the right side.
In pie chart You can easily set best position for the data labels. To perfectly show the data on the roundly chart with a short but sufficient description text, to fully illustrate the data.
Four options to choose:
Center to put them in the middle to the piece of your cake.
Inside End to place them inside, but just near to the ledge.
Outside End to put them outside of chart, but near the ledge.
Best Fit, when You let the Excel to choose the best place for labels.
Unfortunately in doughnut properties there is no such thing like Label Position.
And what is the other difference between pie and doughnut chart?
The hole inside the chart. And that’s it.
So why not put inside the pie a circle, imitating the hole, with the same color as the background of chart? 🙂
You’ll get a doughnut looking chart with pie properties. Isn’t it awesome?
The code
First of all, You need to set basic things, as always, like workbook, worksheet and here most important – chart shape (ch_shape).
Dim wb As Workbook
Dim ws As Worksheet
Dim ch_shape As Shape

Set wb = ThisWorkbook
Set ws = wb.Sheets("donut")
Set ch_shape = ws.Shapes.AddChart2
Secondly let’s set the color, dimensions and position of background (.ChartArea).
With ch_shape.Chart
    With .ChartArea
        .Format.Fill.ForeColor.RGB = RGB(244, 244, 244)
        .Height = 300
        .Width = 450
        .Left = 100
        .Top = 100
    End With
Then choose the type of chart, source data and other properties like title, legend.
    .ChartType = xlPie
    .SetSourceData ws.Range("A1:B8")
    .HasTitle = False
    .HasLegend = False
About data labels I wanted to talk separately. There are several options for this property, the same as I showed You before on the properties picture. Selected below: category name, percentage and new line as separator.
.ApplyDataLabels xlDataLabelsShowLabel, , , , , True, , True, , vbLfThere is one more thing left to do – put those labels outside!
    With .FullSeriesCollection(1).DataLabels
        .Position = xlLabelPositionOutsideEnd
        .NumberFormat = "0.0%"
    End With
After that part of code You’ll get a nice looking pie chart.

It’s time for fake doughnut!
Now final thing to achieve that doughnut look for this pie from above.
You need to create a circle, which will imitate the whole. But before that You need to get the middle point parameters of the chart and its diameter (it is circle, so for example .Height).
    With .PlotArea
        x = .Left
        y = .Top
        h = .Height
    End With
Also set the circle diameter.
cd = 80After that preparations finally You can add the circle. Its .Left position will be the sum of the .Left chart position, half of the chart dimension (chart “radius”) minus half of the circle dimension. Similar thing with .Top position of circle. Thanks to that You will get the circle just right in the middle of the pie chart.
    Set circ = .Shapes.AddShape(msoShapeOval, x + h / 2 - cd / 2, _
        y + h / 2 - cd / 2, cd, cd)
Now just only delete the circle circumference – set the visibility of the line to false, set the same color of the circle as You set for the chart background and additionally, to make it more professional, let’s add a shadow!
    With circ
        .Line.Visible = msoFalse
        .Fill.ForeColor.RGB = RGB(244, 244, 244)
        .Shadow.Type = msoShadow30
    End With
The final effect is stunning!
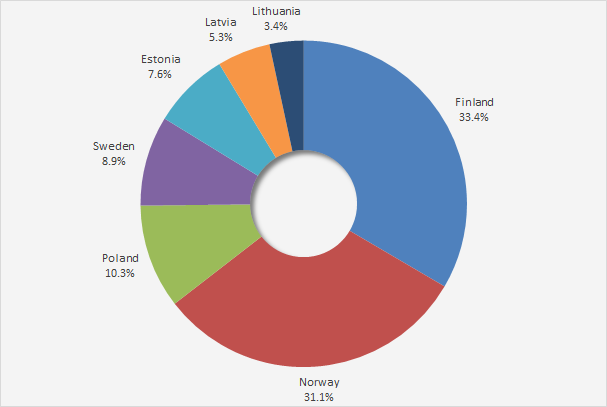
It looks just like a doughnut chart!
Whole code, together!
Option Explicit

Sub pie_as_donut()

Dim wb As Workbook
Dim ws As Worksheet
Dim ch_shape As Shape
Dim lab As DataLabel
Dim x As Long, y As Long, w As Long, h As Long, cd As Long
Dim circ As Shape

Set wb = ThisWorkbook
Set ws = wb.Sheets("donut")
Set ch_shape = ws.Shapes.AddChart2

cd = 80

With ch_shape.Chart
    With .ChartArea
        .Format.Fill.ForeColor.RGB = RGB(244, 244, 244)
        .Height = 300
        .Width = 450
        .Left = 100
        .Top = 100
    End With

    .ChartType = xlPie
    .SetSourceData ws.Range("A1:B8")
    .HasTitle = False
    .HasLegend = False
    .ApplyDataLabels xlDataLabelsShowLabel, , , , , True, , True, , vbLf

    With .FullSeriesCollection(1).DataLabels
        .Position = xlLabelPositionOutsideEnd
        .NumberFormat = "0.0%"
    End With

    With .PlotArea
        x = .Left
        y = .Top
        h = .Height
    End With

    Set circ = .Shapes.AddShape(msoShapeOval, x + h / 2 - cd / 2, _
        y + h / 2 - cd / 2, cd, cd)
    With circ
        .Line.Visible = msoFalse
        .Fill.ForeColor.RGB = RGB(244, 244, 244)
        .Shadow.Type = msoShadow30
    End With
End With

End Sub
Short summary
I hope You will like this idea. Thanks to that, You can achieve outside end data labels in doughnut chart. Without any complex positioning code. Just like that.